|
|

Use the debug serial interface EXEC command to display information on a serial connection failure. The no form of this command disables debugging output.
debug serial interfaceThis command has no arguments or keywords.
EXEC
If the show interface serial command shows that the line and protocol are down, you can use the debug serial interface command to isolate a timing problem as the cause of a connection failure. If the keepalive values in the mineseq, yourseen, and myseen fields are not incrementing in each subsequent line of output, there is a timing or line problem at one end of the connection.
The output of the debug serial interface command can vary, depending on the type of WAN configured for an interface: Frame Relay, HDLC, HSSI, SMDS, or X.25. The output also can vary depending on the type of encapsulation configured for that interface. The hardware platform also can affect debug serial interface output.
The following sections show sample debug serial interface displays for various configurations and describe the possible output the command can generate for these configurations.
The following message is displayed if the encapsulation for the interface is Frame Relay (or HDLC) and the router attempts to send a packet containing an unknown packet type:
Illegal serial link type code xxx
Figure 2-133 shows sample debug serial interface output for an HDLC connection when keepalives are enabled.
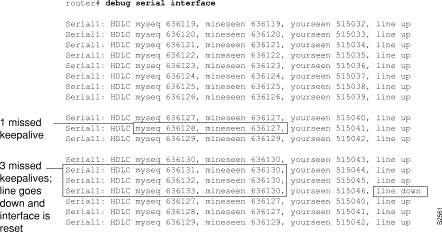
In Figure 2-133, the debug serial interface display shows that the remote router is not receiving all the keepalives the router is sending. When the difference in the values in the myseq and mineseen fields exceeds three, the line goes down and the interface is reset.
Table 2-76 describes significant fields shown in Figure 2-133.
Table 2-77 describes additional error messages that the debug serial interface command can generate for HDLC.
| Field | Description |
|---|---|
| Illegal serial link type code xxx, PC = 0xnnnnnn | This message is displayed if the router attempts to send a packet containing an unknown packet type. |
| Illegal HDLC serial type code xxx, PC = 0xnnnnn | This message is displayed if an unknown packet type is received. |
| Serial 0: attempting to restart | This message is displayed periodically if the interface is down. The hardware is then reset to hopefully correct the problem. |
| Serial 0: Received bridge packet sent to nnnnnnnnn | This message is displayed if a bridge packet is received over a serial interface configured for HDLC, and bridging is not configured on that interface. |
On an HSSI interface, the debug serial interface command can generate the following additional error message:
HSSI0: Reset from 0xnnnnnnn
This message indicates that the HSSI hardware has been reset. The 0xnnnnnnn variable is the address of the routine requesting that the hardware be reset; this value is useful only to development engineers.
Table 2-78 describes error messages that the debug serial interface command can generate for ISDN Basic Rate.
| Message | Description |
|---|---|
| BRI: D-chan collision | A collision on the ISDN D-channel has occurred; the software will retry transmission. |
| Received SID Loss of Frame Alignment int. | The ISDN hardware has lost frame alignment. This usually indicates a problem with the ISDN network. |
| Unexpected IMP int: ipr = 0xnn | The ISDN hardware received an unexpected interrupt. The 0xnn variable indicates the value returned by the interrupt register. |
| BRI(d): RX Frame Length Violation. Length = n
BRI(d): RX Nonoctet Aligned Frame BRI(d): RX Abort Sequence BRI(d): RX CRC Error BRI(d): RX Overrun Error BRI(d): RX Carrier Detect Lost | Any of these messages can be displayed when a receive error occurs on one of the ISDN channels. The (d) indicates which channel it is on. These messages can indicate a problem with the ISDN network connection. |
| BRI0: Reset from 0xnnnnnnn | The BRI hardware has been reset. The 0xnnnnnnn variable is the address of the routine that requested that the hardware be reset; it is useful only to development engineers. |
| BRI(d): Bad state in SCMs scm1 = x scm2 = x scm3 = x
BRI(d): Bad state in SCONs scon1 = x scon2 = x scon3 = x BRI(d): Bad state ub SCR; SCR = x | Any of these messages can be displayed if the ISDN hardware is not in the proper state. The hardware is then reset. If the message is displayed constantly, it usually indicates a hardware problem. |
| BRI(d): Illegal packet encapsulation = n | This message is displayed if a packet is received, but the encapsulation used for the packet is not recognized. It can indicate that the interface is misconfigured. |
Table 2-79 describes the additional error messages that the debug serial interface command can generate for an MK5025 device.
When encapsulation is set to SMDS, debug serial interface displays SMDS packets that are sent and received, as well as any error messages resulting from SMDS packet transmission.
The error messages that the debug serial interface command can generate for SMDS follow.
The following message indicates that a new protocol requested SMDS to encapsulate the data for transmission. SMDS is not yet able to encapsulate the protocol.
SMDS: Error on Serial 0, encapsulation bad protocol = x
The following message indicates that SMDS was asked to encapsulate a packet, but no corresponding destination E.164 SMDS address was found in any of the static SMDS tables or in the ARP tables:
SMDS send: Error in encapsulation, no hardware address, type = x
The following message indicates that a protocol such as CLNS or IP has been enabled on an SMDS interface, but the corresponding multicast addresses have not been configured. The n variable displays the link type for which encapsulation was requested. This value is only significant to Cisco as an internal protocol type value.
SMDS: Send, Error in encapsulation, type=n
The following messages can occur when a corrupted packet is received on an SMDS interface. The router expected x, but received y.
SMDS: Invalid packet, Reserved NOT ZERO,x ySMDS: Invalid packet, TAG mismatchx ySMDS: Invalid packet, Bad TRAILER lengthx y
The following messages can indicate an invalid length for an SMDS packet:
SMDS: Invalid packet, Bad BA lengthxSMDS: Invalid packet, Bad header extension lengthxSMDS: Invalid packet, Bad header extension typexSMDS: Invalid packet, Bad header extension valuex
The following messages are displayed when the debug serial interface command is enabled:
Interface Serial 0 Sending SMDS L3 packet: SMDS: dgsize:xtype:0xnsrc:ydst:z
If the debug serial interface command is enabled, the following message can be displayed when a packet is received on an SMDS interface, but the destination SMDS address does not match any on that interface:
SMDS: Packet n, not addressed to us
Use the debug serial packet EXEC command to display more detailed serial interface debugging information than you can obtain using debug serial interface command. The no form of this command disables debugging output.
debug serial packetThis command has no arguments or keywords.
EXEC
The debug serial packet command generates output that is dependent on the type of serial interface and the encapsulation that is running on that interface. The hardware platform also can impact debug serial packet output.
The debug serial packet command displays output for only SMDS encapsulations.
Figure 2-134 shows sample output when SMDS is enabled on the interface.
router# debug serial packet
Interface Serial2 Sending SMDS L3 packet:
SMDS Header  : Id: 00 RSVD: 00 BEtag: EC Basize: 0044
Dest:E18009999999FFFF Src:C12015804721FFFF Xh:04030000030001000000000000000000
SMDS LLC   : AA AA 03 00 00 00 80 38
SMDS Data  : E1 19 01 00 00 80 00 00 0C 00 38 1F 00 0A 00 80 00 00 0C 01 2B 71
SMDS Data  : 06 01 01 0F 1E 24 00 EC 00 44 00 02 00 00 83 6C 7D 00 00 00 00 00
SMDS Trailer  : RSVD: 00 BEtag: EC Length: 0044
As Figure 2-134 shows, when encapsulation is set to SMDS, debug serial packet displays the entire SMDS header (in hex), as well as some payload data on transmit or receive. This information is useful only when you have an understanding of the SMDS protocol. The first line of the output indicates either Sending or Receiving.
To display debugging messages that monitor the detection and clearing of network alarms on the CSU/DSU, use the debug service-module privileged EXEC command. Use the no debug service-module command to disable debugging messages.
debug service-moduleThis command has no arguments or keywords.
Privileged EXEC
Use this command to enable and disable debug logging for the serial 0 and serial 1 interfaces on the Cisco 2524 and Cisco 2525 routers.
Debug messages can also be viewed by entering the show service-module command.
The following example is output from the debug service-module command:
Router1# debug service-module
Service module debugging is on
SERVICE_MODULE(1): loss of signal ended after duration 00:05:36
SERVICE_MODULE(1): oos/oof ended after duration 01:05:14
SERVICE_MODULE(0): Unit has no clock
SERVICE_MODULE(0): detects loss of signal
SERVICE_MODULE(0): loss of signal ended after duration 00:00:33
Use the debug source bridge EXEC command to display information about packets and frames transferred across a source-route bridge. The no form of this command disables debugging output.
[no] debug source bridgeFigure 2-135 shows sample debug source bridge output for peer bridges using TCP as a transport mechanism. The remote source-route bridging (RSRB) network configuration has ring 2 and ring 1 bridged together through remote peer bridges. The remote peer bridges are connected via a serial line and use TCP as the transport mechanism.
router# debug source bridge
RSRB: remote explorer to 5/131.108.250.1/1996 srn 2 [C840.0021.0050.0000]
RSRB: Version/Ring XReq sent to peer 5/131.108.250.1/1996
RSRB: Received version reply from 5/131.108.250.1/1996 (version 2)
RSRB: DATA: 5/131.108.250.1/1996 Ring Xchg Rep, trn 2, vrn 5, off 18, len 10
RSRB: added bridge 1, ring 1 for 5/131.108.240.1/1996
RSRB: DATA: 5/131.108.250.1/1996 Explorer trn 2, vrn 5, off 18, len 69
RSRB: DATA: 5/131.108.250.1/1996 Forward trn 2, vrn 5, off 0, len 92
RSRB: DATA: forward Forward srn 2, br 1, vrn 5 to peer 5/131.108.250.1/1996
Explanations for individual lines of output in Figure 2-135 follow.
The following line indicates that a remote explorer frame has been sent to IP address 131.108.250.1 and like all RSRB TCP connections, has been assigned port 1996. The bridge belongs to ring group 5. The explorer frame originated from ring number 2. The routing information field (RIF) descriptor has been generated by the local station and indicates that the frame was sent out via bridge 1 onto virtual ring 5.
RSRB: remote explorer to 5/131.108.250.1/1996 srn 2 [C840.0021.0050.0000]
The following line indicates that a request for remote peer information has been sent to IP address 131.108.250.1, TCP port 1996. The bridge belongs to ring group 5.
RSRB: Version/Ring XReq sent to peer 5/131.108.250.1/1996
The following line is the response to the version request previously sent. The response is sent from IP address 131.108.250.1, TCP port 1996. The bridge belongs to ring group 5.
RSRB: Received version reply from 5/131.108.250.1/1996 (version 2)
The following line is the response to the ring request previously sent. The response is sent from IP address 131.108.250.1, TCP port 1996. The target ring number is 2, virtual ring number is 5, the offset is 18, and the length of the frame is 10 bytes.
RSRB: DATA: 5/131.108.250.1/1996 Ring Xchg Rep, trn 2, vrn 5, off 0, len 10
The following line indicates that bridge 1 and ring 1 were added to the source-bridge table for IP address 131.108.250.1, TCP port 1996.
RSRB: added bridge 1, ring 1 for 5/131.108.250.1/1996
The following line indicates that a packet containing an explorer frame came across virtual ring 5 from IP address 131.108.250.1, TCP port 1996. The packet is 69 bytes in length. This packet is received after the Ring Exchange information was received and updated on both sides.
RSRB: DATA: 5/131.108.250.1/1996 Explorer trn 2, vrn 5, off 18, len 69
The following line indicates that a packet containing data came across virtual ring 5 from IP address 131.108.250.1 over TCP port 1996. The packet is being placed on the local target ring 2.The packet is 92 bytes in length.
RSRB: DATA: 5/131.108.250.1/1996 Forward trn 2, vrn 5, off 0, len 92
The following line indicates that a packet containing data is being forwarded to the peer that has IP 131.108.250.1 address belonging to local ring 2 and bridge 1. The packet is forwarded via virtual ring 5. This packet is sent after the Ring Exchange information was received and updated on both sides.
RSRB: DATA: forward Forward srn 2, br 1, vrn 5 to peer 5/131.108.250.1/1996
Figure 2-136 shows sample debug source bridge output for peer bridges using direct encapsulation as a transport mechanism. The RSRB network configuration has ring 1 and ring 2 bridged together through peer bridges. The peer bridges are connected via a serial line and use TCP as the transport mechanism.
router# debug source bridge
RSRB: remote explorer to 5/Serial1 srn 1 [C840.0011.0050.0000]
RSRB: Version/Ring XReq sent to peer 5/Serial1
RSRB: Received version reply from 5/Serial1 (version 2)
RSRB: IFin: 5/Serial1 Ring Xchg, Rep trn 0, vrn 5, off 0, len 10
RSRB: added bridge 1, ring 1 for 5/Serial1
Explanations for individual lines of output in Figure 2-136 follow.
The following line indicates that a remote explorer frame was sent to remote peer Serial1, which belongs to ring group 5. The explorer frame originated from ring number 1. The routing information field (RIF) descriptor 0011.0050 was generated by the local station and indicates that the frame was sent out via bridge 1 onto virtual ring 5.
RSRB: remote explorer to 5/Serial1 srn 1 [C840.0011.0050.0000]
The following line indicates that a request for remote peer information was sent to Serial1. The bridge belongs to ring group 5.
RSRB: Version/Ring XReq sent to peer 5/Serial1
The following line is the response to the version request previously sent. The response is sent from Serial 1. The bridge belongs to ring group 5 and the version is 2.
RSRB: Received version reply from 5/Serial1 (version 2)
The following line is the response to the ring request previously sent. The response is sent from Serial1. The target ring number is 2, virtual ring number is 5, the offset is 0, and the length of the frame is 39 bytes.
RSRB: IFin: 5/Serial1 Ring Xchg Rep, trn 2, vrn 5, off 0, len 39
The following line indicates that bridge 1 and ring 1 were added to the source-bridge table for Serial1.
RSRB: added bridge 1, ring 1 for 5/Serial1
Use the debug source error EXEC command to display source-route bridging errors. The no form of this command disables debugging output.
[no] debug source errorThe debug source error command displays some output also found in the debug source bridge output. Refer to the debug source bridge command for other possible output.
In all of the following examples of debug source error command messages, the variable number is the Token Ring interface. For example, if the line of output starts with SRB1, the output relates to the Token Ring 1 interface. SRB indicates a source-route bridging message. RSRB indicates a remote source-route bridging message. SRTLB indicates a source-route translational bridging message.
In the following example, a packet of protocol protocol-type was dropped:
SRBnumber drop: Routed protocol protocol-type
In the following example, an Address Resolution Protocol (ARP) packet was dropped. ARP is defined in RFC 826.
SRBnumber drop:TYPE_RFC826_ARP
In the following example, the current Cisco IOS version does not support Qualified Logical Link Control (QLLC). Reconfigure the router with an image that has the IBM feature set.
RSRB: QLLC not supported in version version
Please reconfigure.
In the following example, the packet was dropped because the outgoing interface of the router was down:
RSRB IF: outgoing interface not up, dropping packet
In the following example, the router received an out-of-sequence IP sequence number in a Fast Sequenced Transport (FST) packet. FST has no recovery for this problem like TCP encapsulation does.
RSRB FST: bad sequence number dropping.
In the following example, the router was unable to locate the virtual interface:
RSRB: couldn't find virtual interface
In the following example, the peer router's TCP queue is full. TCPD indicates that this is a TCP debug.
RSRB TCPD: tcp queue full for peer
In the following example, the router was unable to send data to the peer router. A result of 1 indicates that the TCP queue is full. A result of -1 indicates that the RSRB peer is closed.
RSRB TCPD: tcp send failed for peer result
In the following example, the Routing Information Identifier was not set in the explorer packet going forward. The packet will not support SRB, so it is dropped.
vrforward_explorer - RII not set
In the following example, a packet sent to a virtual bridge in the router did not include a routing information field (RIF) to tell the router which route to use:
RSRB: no RIF on packet sent to virtual bridge
The following example indicates that the RIF did not contain any information or the length field was set to zero:
RSRB: RIF length of zero sent to virtual bridge
The following message occurs when the local service access point (LSAP) is out of range. The variable lsap-out is the value, type is the type of RSRB peer, and state is the state of the RSRB peer.
VRP: rsrb_lsap_out = lsap-out, type = type, state = state
In the following message, the router is unable to find another router with which to exchange bridge protocol data units (BPDU's). BPDU's are exchanged to set up the spanning tree and determine the forwarding path.
RSRB(span): BPDU's peer not found
debug source bridge
debug source event
Use the debug source event EXEC command to display information on source-route bridging activity. The no form of this command disables debugging output.
[no] debug source eventSome of the output from the debug source bridge and debug source error commands is identical to the output of this command.
Figure 2-137 shows sample debug source event output.
router# debug source event
RSRB0: forward (srn 5 bn 1 trn 10), src: 8110.2222.33c1 dst: 1000.5a59.04f9
[0800.3201.00A1.0050]
RSRB0: forward (srn 5 bn 1 trn 10), src: 8110.2222.33c1 dst: 1000.5a59.04f9
[0800.3201.00A1.0050]
RSRB0: forward (srn 5 bn 1 trn 10), src: 8110.2222.33c1 dst: 1000.5a59.04f9
[0800.3201.00A1.0050]
RSRB0: forward (srn 5 bn 1 trn 10), src: 8110.2222.33c1 dst: 1000.5a59.04f9
[0800.3201.00A1.0050]
RSRB0: forward (srn 5 bn 1 trn 10), src: 8110.2222.33c1 dst: 1000.5a59.04f9
[0800.3201.00A1.0050]
Table 2-80 describes significant fields shown in Figure 2-137.
| Field | Description |
|---|---|
| RSRB0: | Indication that this RIF cache entry is for the Token Ring 0 interface, which has been configured for remote source-route bridging. (SRB1, in contrast, would indicate that this RIF cache entry is for Token Ring 1, configured for source-route bridging.) |
| forward | Forward (normal data) packet, in contrast to a control packet containing proprietary Cisco bridging information. |
| srn 5 | Ring number of the packet's source ring. |
| bn 1 | Bridge number of the bridge this packet traverses. |
| trn 10 | Ring number of the packet's target ring. |
| src: 8110.2222.33c1 | Source address of the route in this RIF cache entry. |
| dst: 1000.5a59.04f9 | Destination address of the route in this RIF cache entry. |
| [0800.3201.00A1.0050] | RIF string in this RIF cache entry. |
Examples of other debug source event messages follow.
In the following example messages, SRBnumber or RSRBnumber denotes a message associated with interface Token Ring number. A number of 99 denotes the remote side of the network.
SRBnumber: no path, s:source-MAC-addrd:dst-MAC-addrrif:rif
In the preceding example, a bridgeable packet came in on interface Token Ring number but there was nowhere to send it. This is most likely a configuration error. For example, an interface has source bridging turned on, but it is not connected to another source bridging interface or a ring group.
In the following example, a bridgeable packet has been forwarded from Token Ring number to the target ring. The two interfaces are directly linked.
SRBnumber: direct forward (srnringbnbridgetrnring)
In the following examples, a proxy explorer reply was not generated because there was no way to get to the address from this interface. The packet came from the node with the first address.
SRBnumber: br dropped proxy XID,addressforaddress, wrong vring (rem) SRBnumber: br dropped proxy TEST,addressforaddress, wrong vring (rem) SRBnumber: br dropped proxy XID,addressforaddress, wrong vring (local) SRBnumber: br dropped proxy TEST,addressforaddress, wrong vring (local) SRBnumber: br dropped proxy XID,addressforaddress, no path SRBnumber: br dropped proxy TEST,addressforaddress, no path
In the following example, an appropriate proxy explorer reply was generated on behalf of the second address. It is sent to the first address.
SRBnumber: br sent proxy XID,addressforaddress[rif] SRBnumber: br sent proxy TEST,addressforaddress[rif]
The following example indicates that the broadcast bits were not set, or that the routing information indicator on the packet was not set:
SRBnumber: illegal explorer, s:source-MAC-addrd:dst-MAC-addrrif:rif
The following example indicates that the direction bit in the RIF field was set, or that an odd packet length was encountered. Such packets are dropped.
SRBnumber: bad explorer control, D set or odd
The following example indicates that a spanning explorer was dropped because the spanning option was not configured on the interface:
SRBnumber: span dropped, input off, s:source-MAC-addrd:dst-MAC-addrrif:rif
The following example indicates that a spanning explorer was dropped because it had traversed the ring previously:
SRBnumber: span violation, s:source-MAC-addrd:dst-MAC-addrrif:rif
The following example indicates that an explorer was dropped because the maximum hop count limit was reached on that interface:
SRBnumber: max hops reached -hop-cnt, s:source-MAC-addrd:dst-MAC-addrrif:rif
The following example indicates that the ring exchange request was sent to the indicated peer. This request tells the remote side which rings this node has and asks for a reply indicating which rings that side has.
RSRB: sent RingXreq toring-group/ip-addr
The following example indicates that a message was sent to the remote peer. The label variable can be AHDR (active header), PHDR (passive header), HDR (normal header), or DATA (data exchange), and op can be Forward, Explorer, Ring Xchg, Req, Ring Xchg, Rep, Unknown Ring Group, Unknown Peer, or Unknown Target Ring.
RSRB:label: sentoptoring-group/ip-addr
The following example indicates that the remote bridge and ring pair were removed from or added to the local ring group table because the remote peer changed:
RSRB: removing bnbridgernringfromring-group/ip-addrRSRB: added bridgebridge, ringringforring-group/ip-addr
The following example shows miscellaneous remote peer connection establishment messages:
RSRB: peerring-group/ip-addrclosed [last staten] RSRB: passive openip-addr(remote port) ->local portRSRB: CONN: opening peerring-group/ip-addr, attemptnRSRB: CONN: Remote closedring-group/ip-addron open RSRB: CONN: peerring-group/ip-addropen failed,reason[code]
The following example shows that an explorer packet was propagated onto the local ring from the remote ring group:
RSRBn: sent local explorer, bridgebridgetrnring, [rif]
The following messages indicate that the remote source-route bridging code found the packet was in error:
RSRBn: ring groupring-groupnot found RSRBn: explorer rif [rif] not long enough
The following example indicates that a buffer could not be obtained for a ring exchange packet; this is an internal error.
RSRB: couldn't get pak for ringXchg
The following example indicates that a ring exchange packet was received that had an incorrect length; this is an internal error.
RSRB: XCHG: req/reply badly formed, lengthpak-length, peerpeer-id
The following example indicates that a ring entry was removed for the peer; the ring was possibly disconnected from the network, causing the remote router to send an update to all its peers.
RSRB: removing bridgebridgeringringfrompeer-idring-type
The following example indicates that a ring entry was added for the specified peer; the ring was possibly added to the network, causing the other router to send an update to all its peers.
RSRB: added bridgebridge, ringringforpeer-id
The following example indicates that no memory was available to add a ring number to the ring group specified; this is an internal error.
RSRB: no memory for ring element ring-group
The following example indicates that memory was corrupted for a connection block; this is an internal error.
RSRB: CONN: corrupt connection block
The following example indicates that a connector process started, but that there was no packet to process; this is an internal error.
RSRB: CONN: warning, no initial packet, peer: ip-addr peer-pointer
The following example indicates that a packet was received with a version number different from the one present on the router:
RSRB: IF New version. local=local-version, remote=remote-version,pak-op-codepeer-id
The following example indicates that a packet with a bad op code was received for a direct encapsulation peer; this is an internal error.
RSRB: IFin: bad opop-code(op codestring) frompeer-id
The following example indicates that the virtual ring header will not fit on the packet to be sent to the peer; this is an internal error:
RSRB: vrif_sender, hdr won't fit
The following example indicates that the specified peer is being opened. The retry count specifies the number of times the opening operation is attempted.
RSRB: CONN: opening peerpeer-idretry-count
The following example indicates that the router, configured for FST encapsulation, received a version reply to the version request packet it had sent previously:
RSRB: FST Rcvd version reply frompeer-id(versionversion-number)
The following example indicates that the router, configured for FST encapsulation, sent a version request packet to the specified peer:
RSRB: FST Version Request. op =opcode,peer-id
The following example indicates that the router received a packet with a bad op code from the specified peer; this is an internal error.
RSRB: FSTin: bad opopcode(op codestring) frompeer-id
The following example indicates that the TCP connection between the router and the specified peer is being aborted:
RSRB: abortingring-group/peer-id(vrtcpd_abort called)
The following example indicates that an attempt to establish a TCP connection to a remote peer timed out:
RSRB: CONN: attempt timed out
The following example indicates that a packet was dropped because the ring group number in the packet did not correlate with the ring groups configured on the router:
RSRBnumber: ring groupring-groupnot found
Use the debug span EXEC command to display information on changes in the spanning-tree topology when debugging a transparent bridge. The no form of this command disables debugging output.
debug spanThis command has no arguments or keywords.
EXEC
This command is useful for tracking and verifying that the spanning-tree protocol is operating correctly.
Sample debug span output for an IEEE BPDU packet follows:
ST: Ether4 0000000000000A080002A02D6700000000000A080002A02D6780010000140002000F00
Figure 2-138 shows the preceding debug span output broken up by fields and labeled to aid documentation.

Table 2-81 describes significant fields shown in Figure 2-138.
| Field | Description |
|---|---|
| ST: | Indication that this is a spanning tree packet. |
| Ether4 | Interface receiving the packet. |
| (A) 0000 | Indication that this is an IEEE BPDU packet. |
| (B) 00 | Version. |
| (C) 00 | Command mode:
00 indicates config BPDU. |
| (D) 00 | Topology change acknowledgment:
00 indicates no change. 80 indicates a change notification. |
| (E) 000A | Root priority. |
| (F) 080002A02D67 | Root ID. |
| (G) 00000000 | Root path cost (0 means the sender of this BPDU packet is the root bridge). |
| (H) 000A | Bridge priority. |
| (I) 080002A02D67 | Bridge ID. |
| (J) 80 | Port priority. |
| (K) 01 | Port No. 1. |
| (L) 0000 | Message age in 256ths of a second (0 seconds, in this case). |
| (M) 1400 | Maximum age in 256ths of a second (20 seconds, in this case). |
| (N) 0200 | Hello time in 256ths of a second (2 seconds, in this case). |
| (O) 0F00 | Forward delay in 256ths of a second (15 seconds, in this case). |
Sample debug span output for a DEC BPDU packet follows:
ST: Ethernet4 E1190100000200000C01A2C90064008000000C0106CE0A01050F1E6A
Figure 2-139 shows the preceding debug span output broken up by fields and labeled to aid documentation.

Table 2-82 describes significant fields shown in Figure 2-139.
Use the debug sse EXEC command to display information for the silicon switching engine (SSE) processor. The no form of this command disables debugging output.
debug sseThis command has no arguments or keywords.
EXEC
By using the debug sse command, you can observe statistics and counters maintained by the SSE.
Figure 2-140 shows sample debug sse output.
router# debug sse
SSE: IP number of cache entries changed 273 274
SSE: IP number of cache entries changed 273 274
SSE: bridging enabled
SSE: interface Ethernet0/0 icb 0x30 addr 0x29 status 0x21A040 protos 0x11
SSE: interface Ethernet0/1 icb 0x33 addr 0x29 status 0x21A040 protos 0x11
SSE: interface Ethernet0/2 icb 0x36 addr 0x29 status 0x21A040 protos 0x10
SSE: interface Ethernet0/3 icb 0x39 addr 0x29 status 0x21A040 protos 0x11
SSE: interface Ethernet0/4 icb 0x3C addr 0x29 status 0x21A040 protos 0x10
SSE: interface Ethernet0/5 icb 0x3F addr 0x29 status 0x21A040 protos 0x11
SSE: interface Hssi1/0 icb 0x48 addr 0x122 status 0x421E080 protos 0x11
SSE: cache update took 316ms, elapsed 320ms
Explanations for representative lines of output in Figure 2-140 follow.
The following line indicates that the SSE cache is being updated due to a change in the IP fast switching cache:
SSE: IP number of cache entries changed 273 274
The following line indicates that bridging functions were enabled on the SSE:
SSE: bridging enabled
The following lines indicate that the SSE is now loaded with information about the interfaces:
SSE: interface Ethernet0/0 icb 0x30 addr 0x29 status 0x21A040 protos 0x11
SSE: interface Ethernet0/1 icb 0x33 addr 0x29 status 0x21A040 protos 0x11
SSE: interface Ethernet0/2 icb 0x36 addr 0x29 status 0x21A040 protos 0x10
SSE: interface Ethernet0/3 icb 0x39 addr 0x29 status 0x21A040 protos 0x11
SSE: interface Ethernet0/4 icb 0x3C addr 0x29 status 0x21A040 protos 0x10
SSE: interface Ethernet0/5 icb 0x3F addr 0x29 status 0x21A040 protos 0x11
SSE: interface Hssi1/0 icb 0x48 addr 0x122 status 0x421E080 protos 0x11
The following line indicates that the SSE took 316 ms of processor time to update the SSE cache. The value of 320 ms represents the total time elapsed while the cache updates were performed.
SSE: cache update took 316ms, elapsed 320ms
Use the debug standby EXEC command to display hot standby protocol state changes. The no form of this command disables debugging output.
debug standbyThis command has no arguments or keywords.
EXEC
The debug standby command displays hot standby protocol state changes and debugging information regarding transmission and receipt of hot standby protocol packets. Use this command to determine whether hot standby routers recognize one another and take the proper actions.
Figure 2-141 shows sample debug standby output.
router# debug standby
SB: Ethernet0 state Virgin -> Listen
SB: Starting up hot standby process
SB:Ethernet0 Hello in 198.92.72.21 Active pri 90 hel 3 hol 10 ip 198.92.72.29
SB:Ethernet0 Hello in 198.92.72.21 Active pri 90 hel 3 hol 10 ip 198.92.72.29
SB:Ethernet0 Hello in 198.92.72.21 Active pri 90 hel 3 hol 10 ip 198.92.72.29
SB:Ethernet0 Hello in 198.92.72.21 Active pri 90 hel 3 hol 10 ip 198.92.72.29
SB: Ethernet0 state Listen -> Speak
SB:Ethernet0 Hello out 198.92.72.20 Speak pri 100 hel 3 hol 10 ip 198.92.72.29
SB:Ethernet0 Hello in 198.92.72.21 Active pri 90 hel 3 hol 10 ip 198.92.72.29
SB:Ethernet0 Hello out 198.92.72.20 Speak pri 100 hel 3 hol 10 ip 198.92.72.29
SB:Ethernet0 Hello in 198.92.72.21 Active pri 90 hel 3 hol 10 ip 198.92.72.29
SB:Ethernet0 Hello out 198.92.72.20 Speak pri 100 hel 3 hol 10 ip 198.92.72.29
SB:Ethernet0 Hello in 198.92.72.21 Active pri 90 hel 3 hol 10 ip 198.92.72.29
SB: Ethernet0 state Speak -> Standby
SB:Ethernet0 Hello out 198.92.72.20 Standby pri 100 hel 3 hol 10 ip 198.92.72.29
SB:Ethernet0 Hello in 198.92.72.21 Active pri 90 hel 3 hol 10 ip 198.92.72.29
SB:Ethernet0 Hello out 198.92.72.20 Standby pri 100 hel 3 hol 10 ip 198.92.72.29
SB:Ethernet0 Hello in 198.92.72.21 Active pri 90 hel 3 hol 10 ip 198.92.72.29
SB:Ethernet0 Hello out 198.92.72.20 Standby pri 100 hel 3 hol 10 ip 198.92.72.29
SB:Ethernet0 Hello in 198.92.72.21 Active pri 90 hel 3 hol 10 ip 198.92.72.29
SB: Ethernet0 Coup out 198.92.72.20 Standby pri 100 hel 3 hol 10 ip 198.92.72.29
SB: Ethernet0 state Standby -> Active
SB:Ethernet0 Hello out 198.92.72.20 Active pri 100 hel 3 hol 10 ip 198.92.72.29
SB:Ethernet0 Hello in 198.92.72.21 Speak pri 90 hel 3 hol 10 ip 198.92.72.29
SB:Ethernet0 Hello out 198.92.72.20 Active pri 100 hel 3 hol 10 ip 198.92.72.29
SB:Ethernet0 Hello in 198.92.72.21 Speak pri 90 hel 3 hol 10 ip 198.92.72.29
SB:Ethernet0 Hello out 198.92.72.20 Active pri 100 hel 3 hol 10 ip 198.92.72.29
Table 2-83 describes significant fields shown in Figure 2-141.
Explanations for representative lines of output in Figure 2-141 follow.
The following line indicates that the router is initiating the hot standby protocol. The standby ip interface configuration command enables hot standby.
SB: Starting up hot standby process
The following line indicates that a state transition occurred on the interface:
SB: Ethernet0 state Listen -> Speak
Use the debug stun packet EXEC command to display information on packets traveling through the serial tunnel (STUN) links. Use the no form of this command to disable debugging output.
debug stun packet [group] [address]
no debug stun packet [group] [address]
| group | (Optional) Decimal integer assigned to a group. Using this option limits output to packets associated with the specified STUN group. |
| address | (Optional) Output is further limited to only those packets containing the specified STUN address. The address argument is in the appropriate format for the STUN protocol running for the specified group. |
EXEC
Because using this command is processor intensive, it is best to use it after hours, rather than in a production environment. It is also best to turn this command on by itself, rather than use it in conjunction with other debug commands.
Figure 2-142 shows sample debug stun packet output.
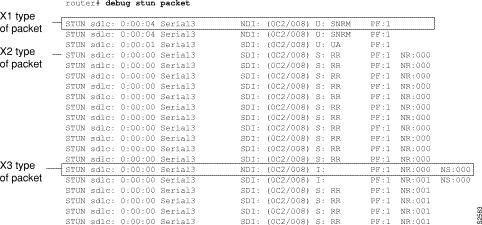
Explanations for individual lines of output from Figure 2-142 follow.
The following line describes an X1 type of packet:
STUN sdlc: 0:00:04 Serial3 NDI: (0C2/008) U: SNRM PF:1
Table 2-84 describes significant fields shown in this line of debug stun packet output.
| Field | Description |
|---|---|
| STUN sdlc: | Indication that the STUN feature is providing the information. |
| 0:00:04 | Time elapsed since receipt of previous packet. |
| Serial3 | Interface type and unit number reporting the event. |
| NDI: | The type of cloud separating the SDLC end nodes. Possible values follow:
NDI--Network input SDI--Serial link |
| 0C2 | SDLC address of the SDLC connection. |
| 008 | A modulo value of 8. |
| U:SNRM | The frame type followed by the command or response type. In this case it is an Unnumbered frame that contains an SNRM (Set Normal Response Mode) command. The possible frame types are as follows:
I--Information frame S--Supervisory frame. The possible commands and responses are: RR (Receive Ready), RNR (Receive Not Ready), and REJ (Reject). U--Unnumbered frame. The possible commands are: UI (Unnumbered Information), SNRM, DISC/RD (Disconnect/Request Disconnect), SIM/RIM, XID Exchange Identification), TEST. The possible responses are UA (unnumbered acknowledgment), DM (Disconnected Mode), and FRMR (Frame Reject Mode) |
| PF:1 | Poll/Final bit.
0--Off 1--On |
The following line of output describes an X2 type of packet:
STUN sdlc: 0:00:00 Serial3 SDI: (0C2/008) S: RR PF:1 NR:000
All the fields in the previous line of output match those for an X1 type of packet, except the last field, which is additional. NR:000 indicates a receive count of 0; the range for the receive count is 0 to 7.
The following line of output describes an X3 type of packet:
STUN sdlc: 0:00:00 Serial3 SDI: (0C2/008) S:I PF:1 NR:000 NS:000
All fields in the previous line of output match those for an X2 type of packet, except the last field, which is additional. NS:000 indicates a send count of 0; the range for the send count is 0 to 7.
Use the debug tftp EXEC command to display Trivial File Transfer Protocol (TFTP) debugging information when encountering problems netbooting or using the configure network or write network commands. The no form of this command disables debugging output.
debug tftpThis command has no arguments or keywords.
EXEC
Figure 2-143 shows sample debug tftp output from the EXEC command write network.
router# debug tftp
TFTP: msclock 0x292B4; Sending  write request (retry 0), socket_id 0x301DA8
TFTP: msclock 0x2A63C; Sending  write request (retry 1), socket_id 0x301DA8
TFTP: msclock 0x2A6DC; Received ACK for block 0,   socket_id 0x301DA8
TFTP: msclock 0x2A6DC; Received ACK for block 0,   socket_id 0x301DA8
TFTP: msclock 0x2A6DC; Sending  block 1 (retry 0), socket_id 0x301DA8
TFTP: msclock 0x2A6E4; Received ACK for block 1,   socket_id 0x301DA8
Table 2-85 describes significant fields shown in the first line of output from Figure 2-143.
| Message | Description |
|---|---|
| TFTP: | This entry describes a TFTP packet. |
| msclock 0x292B4; | Internal timekeeping clock (in milliseconds). |
| Sending write request (retry 0) | The TFTP operation. |
| socket_id 0x301DA8 | Unique memory address for the socket for the TFTP connection. |
Use the debug token ring EXEC command to display messages about Token Ring interface activity. The no form of this command disables debugging output.
debug token ringThis command has no arguments or keywords.
EXEC
This command reports several lines of information for each packet sent or received and is intended for low traffic, detailed debugging.
The Token Ring interface records provide information regarding the current state of the ring. These messages are only displayed when the debug token events command is enabled.
The debug token ring command invokes verbose Token Ring hardware debugging. This includes detailed displays as traffic arrives and departs the unit.
Figure 2-144 shows sample debug token ring output.
router# debug token ring
TR0: Interface is alive, phys. addr 5000.1234.5678
TR0:  in: MAC: acfc: 0x1105 Dst: c000.ffff.ffff Src: 5000.1234.5678  bf: 0x45
TR0:  in:      riflen 0, rd_offset 0, llc_offset 40
TR0: out: MAC: acfc: 0x0040 Dst: 5000.1234.5678 Src: 5000.1234.5678  bf: 0x00
TR0: out: LLC: AAAA0300 00009000 00000100 AAC00000 00000802 50001234 ln: 28
TR0:  in: MAC: acfc: 0x1140 Dst: 5000.1234.5678 Src: 5000.1234.5678  bf: 0x09
TR0:  in: LLC: AAAA0300 00009000 00000100 AAC0B24A 4B4A6768 74732072 ln: 28
TR0:  in:      riflen 0, rd_offset 0, llc_offset 14
TR0: out: MAC: acfc: 0x0040 Dst: 5000.1234.5678 Src: 5000.1234.5678  bf: 0x00
TR0: out: LLC: AAAA0300 00009000 00000100 D1D00000 FE11E636 96884006 ln: 28
TR0:  in: MAC: acfc: 0x1140 Dst: 5000.1234.5678 Src: 5000.1234.5678  bf: 0x09
TR0:  in: LLC: AAAA0300 00009000 00000100 D1D0774C 4DC2078B 3D000160 ln: 28
TR0:  in:      riflen 0, rd_offset 0, llc_offset 14
TR0: out: MAC: acfc: 0x0040 Dst: 5000.1234.5678 Src: 5000.1234.5678  bf: 0x00
TR0: out: LLC: AAAA0300 00009000 00000100 F8E00000 FE11E636 96884006 ln: 28
Table 2-86 describes significant fields shown in the second line of output from Figure 2-144.
| Message | Description |
|---|---|
| TR0: | Name of the interface associated with the Token Ring event. |
| in: | Indication of whether the packet was input to the interface (in) or output from the interface (out). |
| MAC: | The type of packet, as follows:
MAC--Media Access Control LLC--Link Level Control |
| acfc: 0x1105 | Access Control, Frame Control bytes, as defined by the IEEE 802.5 standard. |
| Dst: c000.ffff.ffff | Destination address of the frame. |
| Src: 5000.1234.5678 | Source address of the frame. |
| bf: 0x45 | Bridge flags for internal use by technical support staff. |
Table 2-87 describes significant fields shown in the third line of output from Figure 2-144.
| Message | Description |
|---|---|
| TR0: | Name of the interface associated with the Token Ring event. |
| in: | Indication of whether the packet was input to the interface (in) or output from the interface (out). |
| riflen 0 | Length of the RIF field (in bytes). |
| rd_offset 0 | Offset (in bytes) of the frame pointing to the start of the RIF field. |
| llc_offset 40 | Offset in the frame pointing to the start of the LLC field. |
Table 2-88 describes significant fields shown in the fifth line of output from Figure 2-144.
| Message | Description |
|---|---|
| TR0: | Name of the interface associated with the Token Ring event. |
| out: | Indication of whether the packet was input to the interface (in) or output from the interface (out). |
| LLC: | The type of frame, as follows:
MAC--Media Access Control LLC--Link Level Control |
| AAAA0300 | This and the octets that follow it indicate the contents (hex) of the frame. |
| ln: 28 | The length of the information field (in bytes). |
Use the debug vines arp EXEC command to display debugging information on all Virtual Integrated Network Service (VINES) Address Resolution Protocol (ARP) packets that the router sends or receives. The no form of this command disables debugging output.
debug vines arpThis command has no arguments or keywords.
EXEC
Figure 2-145 shows sample debug vines arp output.
router# debug vines arp
VNSARP: received ARP type 0 from 0260.8c43.a7e4
VNSARP: sending ARP type 1 to 0260.8c43.a7e4
VNSARP: received ARP type 2 from 0260.8c43.a7e4
VNSARP: sending ARP type 3 to 0260.8c43.a7e4 assigning address 3001153C:8004
VSARP: received ARP type 0 from 0260.8342.1501
VSARP: sending ARP type 1 to 0260.8342.1501
VSARP: received ARP type 2 from 0260.8342.1501
VSARP: sending ARP type 3 to 0260.8342.1501 assigning address 3001153C:8005,
       sequence 143C, metric 2
In Figure 2-145, the first four lines show a non-sequenced ARP transaction and the second four lines show a sequenced ARP transaction. Within the first group of four lines, the first line shows that the router received an ARP request (type 0) from indicated station address 0260.8c43.a7e4. The second line shows that the router is sending back the ARP service response (type 1), indicating that it is willing to assign VINES Internet addresses. The third line shows that the router received a VINES Internet address assignment request (type 2) from address 0260.8c43.a7e4. The fourth line shows that the router is responding (type 3) to the address assignment request from the client and assigning it the address 3001153C:8004.
Within the second group of four lines, the sequenced ARP packet also includes the router' current sequence number and the metric value between the router and the client.
Table 2-89 describes significant fields shown in Figure 2-145.
Use the debug vines echo EXEC command to display information on all MAC-level echo packets that the router sends or receives. Banyan VINES interface testing programs make use of these echo packets. The no form of this command disables debugging output.
debug vines echoThis command has no arguments or keywords.
EXEC
Figure 2-146 shows sample debug vines echo output.
router# debug vines echo
VINESECHO: 100 byte packet from 0260.8c43.a7e4
Table 2-90 describes the fields shown in Figure 2-146.
| Field | Description |
|---|---|
VINESECHO
| Indication that this is a debug vines echo message. |
| 100 byte packet | Packet size in bytes. |
| from 0260.8c43.a7e4 | Source address of the echo packet. |
Use the debug vines ipc EXEC command to display information on all transactions that occur at the VINES IPC layer, which is one of the two VINES transport layers. The no form of this command disables debugging output.
debug vines ipcThis command has no arguments or keywords.
EXEC
You can use the debug vines ipc command to discover why an IPC layer process on the router is not communicating with another IPC layer process on another router or Banyan VINES server.
Figure 2-147 shows sample debug vines ipc output for three pairs of transactions. For more information about these fields or their values, refer to Banyan VINES documentation.
router# debug vines ipc
VIPC: sending IPC Data to Townsaver port 7 from port 7
 r_cid 0, l_cid 1, seq 1, ack 0, length 12
VIPC: received IPC Data from Townsaver port 7 to port 7
 r_cid 51, l_cid 1, seq 1, ack 1, length 32
VIPC: sending IPC Ack to Townsaver port 0 from port 0
 r_cid 51, l_cid 1, seq 1, ack 1, length 0
Table 2-91 describes the fields shown in Figure 2-147.
Use the debug vines netrpc EXEC command to display information on all transactions that occur at the VINES NetRPC layer, which is the VINES Session/Presentation layer. The no form of this command disables debugging output.
debug vines netrpcThis command has no arguments or keywords.
EXEC
You can use the debug vines netrpc command to discover why a NetRPC layer process on the router is not communicating with another NetRPC layer process on another router or Banyan server.
Figure 2-148 shows sample debug vines netrpc output. For more information about these fields or their values, refer to Banyan VINES documentation.
router# debug vines netrpc
VRPC: sending RPC call to Townsaver
VRPC: received RPC return from Townsaver
Table 2-92 describes the fields shown in the first line of output in Figure 2-148.
Use the debug vines packet EXEC command to display general VINES debugging information. This information includes packets received, generated, and forwarded, as well as failed access checks and other operations. The no form of this command disables debugging output.
debug vines packetThis command has no arguments or keywords.
EXEC
Figure 2-149 shows sample debug vines packet output.
router# debug vines packet
VINES: s=30028CF9:1 (Ether2), d=FFFFFFFF:FFFF, rcvd w/ hops 0
VINES: s=3000CBD4:1 (Ether1), d=3002ABEA:1 (Ether2), g=3002ABEA:1, sent
VINES: s=3000CBD4:1 (Ether1), d=3000B959:1, rcvd by gw
VINES: s=3000B959:1 (local), d=3000CBD4:1 (Ether1), g=3000CBD4:1, sent
The following information describes selected lines of output from Figure 2-149.
Table 2-93 describes the fields shown in the first line of output.
| Field | Description |
|---|---|
VINES:
| Indicates that this is a Banyan VINES packet. |
| s = 30028CF9:1 | Indicates source address of the packet. |
| (Ether2) | Indicates the interface through which the packet was received. |
| d = FFFFFFFF:FFFF | Indicates that the destination is a broadcast address. |
| rcvd w/ hops 0 | Indicates that the packet was received because it was a local broadcast packet. The remaining hop count in the packet was zero (0). |
In the following line, the destination is the address 3002ABEA:1 associated with interface Ether2. Source address 3000CBD4:1 sent a packet to this destination through the gateway at address 3000ABEA:1.
VINES: s=3000CBD4:1 (Ether1), d=3002ABEA:1 (Ethernet2), g=3002ABEA:1, sent
In the following line, the router being debugged is the destination address (3000B959:1):
VINES: s=3000CBD4:1 (Ether1), d=3000B959:1, rcvd by gw
In the following line, (local) indicates that the router being debugged generated the packet:
VINES: s=3000B959:1 (local), d=3000CBD4:1 (Ether1), g=3000CBD4:1, sent
Use the debug vines routing EXEC command to display information on all VINES RTP update messages sent or received and all routing table activities that occur in the router. The no form of this command disables debugging output.
debug vines routing [verbose]| verbose | (Optional) Provides detailed information about the contents of each update. |
EXEC
Figure 2-150 shows sample debug vines routing output.
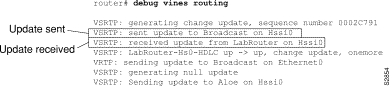
Figure 2-151 shows sample debug vines routing verbose output.
router# debug vines routing verbose
VRTP: sending update to Broadcast on Ethernet0
    network 30011E7E, metric 0020 (0.4000 seconds)
    network 30015800, metric 0010 (0.2000 seconds)
    network 3003148A, metric 0020 (0.4000 seconds)
VSRTP: generating change update, sequence number 0002C795
    network Router9        metric 0010, seq 00000000, flags 09
    network RouterZZ       metric 0230, seq 00052194, flags 02
VSRTP: sent update to Broadcast on Hssi0
VSRTP: received update from LabRouter on Hssi0
    update: type 00, flags 07, id 000E, ofst 0000, seq 15DFC, met 0010
    network LabRouter from the server
    network Router9        metric 0020, seq 00000000, flags 09
VSRTP: LabRouter-Hs0-HDLC up -> up, change update, onemore
Figure 2-151 describes two VINES routing updates; the first includes two entries and the second includes three entries. The following information describes selected lines of output.
The following line shows that the router sent a periodic routing update to the broadcast address FFFFFFFF:FFFF through the Ethernet0 interface:
VRTP: sending update to Broadcast on Ethernet0
The following line indicates that the router knows how to reach network 30011E7E, which is a metric of 0020 away from the router. The value that follows the metric (0.4000 seconds) interprets the metric in seconds.
network 30011E7E, metric 0020 (0.4000 seconds)
The following lines show that the router sent a change routing update to the Broadcast addresses on the Hssi0 interface using the Sequenced Routing Update Protocol (SRTP) routing protocol:
VSRTP: generating change update, sequence number 0002C795
VSRTP: Sending update to Broadcast on Hssi0
The lines in between the previous two indicate that the router knows how to reach network Router9, which is a metric of 0010 (0.2000 seconds) away from the router. The sequence number for Router9 is zero, and according to the 0x08 bit in the flags field, is invalid. The 0x01 bit of the flags field indicates that Router9 is attached via a LAN interface.
network Router9 metric 0010, seq 00000000, flags 09
The next lines indicate that the router can reach network RouterZZ, which is a metric of 0230 (7.0000 seconds) away from the router. The sequence number for RouterZZ is 0052194. The 0x02 bit of the flags field indicates that RouterZZ is attached via a WAN interface.
network RouterZZ metric 0230, seq 00052194, flags 02
The following line indicates that the router received a routing update from the router LabRouter through the Hssi0 interface:
VINESRTP: received update from LabRouter on Hssi0
The following line displays all SRTP values contained in the header of the SRTP packet. This is a type 00 packet, which is a routing update, and the flags field is set to 07, indicating that this is a change update (0x04) and contains both the beginning (0x01) and end (0x02) of the update. This overall update is update number 000E from the router, and this fragment of the update contains the routes beginning at offset 0000 of the update. The sending router's sequence number is currently 00015DFC, and its configured metric for this interface is 0010.
update: type 00, flags 07, id 000E, ofst 0000, seq 00015DFC, met 0010
The following line implies that the server sending this update is directly accessible to the router (even though VINES servers do not explicitly list themselves in routing updates). Because this is an implicit entry in the table, the other information for this entry is taken from the previous line.
network LabRouter from the server
As the first actual entry in the routing update from LabRouter, the following line indicates that Router9 can be reached by sending to this server. This network is a metric of 0020 away from the sending server.
network Router9 metric 0020, seq 00000000, flags 09
Use the debug vines service EXEC command to display information on all transactions that occur at the VINES Service (or applications) layer. The no form of this command disables debugging output.
debug vines serviceThis command has no arguments or keywords.
EXEC
You can use the debug vines service command to discover why a VINES Service layer process on the router is not communicating with another Service layer process on another router or Banyan server.
Figure 2-152 shows sample debug vines service output.
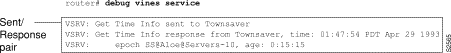
As Figure 2-152 suggests, debug vines service lines of output appear as activity pairs--either a sent/response pair as shown, or as a received/sent pair.
Table 2-94 describes the fields shown in the second line of output in Figure 2-152. For more information about these fields or their values, refer to Banyan VINES documentation.
| Field | Description |
|---|---|
VSRV:
| Indicates that this is output from the debug vines service command. |
| Get Time Info | Indicates one of three packet types:
Get Time Info Time Set Time Sync |
| response from | Indicates whether the packet was sent to another router, a response from another router, or received from another router. |
| Townsaver | Indicates the machine name as assigned using the VINES host command, or IP address of the other router. |
| time: 01:47:54 PDT Apr 29 1993 | Indicates the current time in hours:minutes:seconds and current date. |
Table 2-95 describes the fields shown in the third line of output in Figure 2-152. This line is an extension of the first two lines of output. For more information about these fields or their values, refer to Banyan VINES documentation.
| Field | Description |
|---|---|
VSRV:
| Output from the debug vines service command. |
| epoch | Line of output that describes a VINES epoch. |
| SS@Aloe@Servers-10 | Epoch name. |
| age: 0:15:15 | Epoch--elapsed time since the time was last set in the network. |
Use the debug vines state EXEC command to display information on the VINES SRTP state machine transactions. The no form of this command disables debugging output.
debug vines stateThis command has no arguments or keywords.
EXEC
This command provides a subset of the information provided by the debug vines routing command, showing only the transactions made by the SRTP state machine. Refer to the debug vines routing command for descriptions of output from the debug vines state command.
Use the debug vines table EXEC command to display information on all modifications to the VINES routing table. The no form of this command disables debugging output.
debug vines tableThis command has no arguments or keywords.
EXEC
This command provides a subset of the information produced by the debug vines routing command, as well as some more detailed information on table additions and deletions.
Figure 2-153 shows sample debug vines table output.
router# debug vines table
VINESRTP: create neighbor 3001153C:8004, interface Ethernet0
Table 2-96 describes significant fields shown in Figure 2-153.
| Field | Description |
|---|---|
VINESRTP:
| Indicates that this is a debug vines routing or debug vines table message. |
| create neighbor 3001153C:8004 | Indicates that the client at address 3001153C:8004 has been added to the Banyan VINES neighbor table. |
interface Ethernet 0
| Indicates that this neighbor can be reached through the router interface named Ethernet0. |
Use the debug x25 all EXEC command to display information on all X.25 traffic, including data, control messages, and flow control (RR and RNR) packets. The no form of this command disables debugging output.
debug x25 allThis command has no arguments or keywords.
EXEC
This command is particularly useful for diagnosing problems encountered when placing calls.
The debug x25 all output includes data, control messages, and flow control packets for all of the router's virtual circuits. The debug x25 events and debug x25 vc commands provide a subset of this output.
 | Caution Because debug x25 all displays all X.25 traffic, it is processor intensive and can render the router useless. Only use debug x25 all when the aggregate of all X.25 traffic is fewer than five packets per second. This command is useful only on low-speed, low-usage links running below 19.2 Kbps. |
Figure 2-154 shows sample debug x25 all output.
router# debug x25 all
Serial2: X25 O R3 RESTART (5) 8 lci 0 cause 7 diag 0
Serial2: X25 I R3 RESTART (5) 8 lci 0 cause 0 diag 0
Serial2: X25 I P1 CALL REQUEST (11) 8 lci 1024
From (2): 49 To(2): 46
  Facilities: (0)
  Call User Data (4): 0xCC 00 00 00 (ip)
Serial2: X25 O P4 CALL CONNECTED (3) 8 lci 1024
Serial2: X25 I P4 DATA (103) 8 lci 1024 PS 0 PR 0
Serial2: X25 O D1 DATA (103) 8 lci 1024 PS 0 PR 1
Serial2: X25 I D1 DATA (103) 8 lci 1024 PS 1 PR 0
Serial2: X25 O D1 DATA (103) 8 lci 1024 PS 1 PR 2
Serial2: X25 I D1 RR (3) 8 lci 1024 PR 2
Serial2: X25 I D1 DATA (103) 8 lci 1024 PS 2 PR 2
Serial2: X25 O D1 DATA (103) 8 lci 1024 PS 2 PR 3
Serial2: X25 I D1 CLEAR REQUEST (5) 8 lci 1024 cause 0 diag 122
Serial2: X25 O D1 CLEAR CONFIRMATION (3) 8 lci 1024
XOT: X25 O D1 PVC-SETUP, waiting to connect (29) <Serial2 pvc 3><Serial2 pvc 1> 2/1 128/64
XOT: X25 I D1 PVC-SETUP, connected (29) <Serial2 pvc 3><Serial2 pvc 1> 2/1 128/64
Serial2: X25 O D1 RESET REQUEST (5) 8 lci 3 cause 15 diag 0
Serial2: X25 I D1 RESET CONFIRMATION (3) 8 lci 3
Figure 2-154 shows a typical exchange of packets between two X.25 devices on a network. The first line of output in Figure 2-154 describes a RESTART packet. Table 2-97 describes the fields in this line of output.
| Field | Description |
|---|---|
| Serial2 | The interface on which the X.25 event occured. Events that occur on an X.25-over-TCP connection report XOT. |
| X25 | That this message describes an X.25 event. |
O
| Indication of whether the X.25 message was input (I) or output (O) through the interface. |
R3
| State of the virtual circuit. Possible values follow:
D1--Flow control ready D2--DTE reset request D3--DCE reset indication P1--Idle P2--DTE waiting for DCE to connect CALL P3--DCE waiting for DTE to accept CALL P4--Data transfer P5--CALL collision |
R3 (Continued)
| P6--DTE clear request
P7--DCE clear indication R1--Packet level ready R2--DTE restart request R3--DCE restart indication X1--Nonstandard state for a virtual circuit in hold-down See Annex B of the 1984 ITU-T X.25 Recommendation for more information on these states. |
RESTART
| The type of X.25 packet. Possible values follow:
CALL CONNECTED CALL REQUEST CLEAR CONFIRMATION CLEAR REQUEST DATA DIAGNOSTIC ILLEGAL INTR CONFIRMATION INTR (interrupt) PVC-SETUP REGISTRATION REGISTRATION CONFIRMATION RESET CONFIRMATION RESET REQUEST RESTART RESTART CONFIRMATION RNR (Receiver Not Ready) RR (Receiver Ready) |
| (5) | Number of bytes in the packet. |
| 8 | Modulo of the virtual circuit. Possible values are 8 or 128. |
| lci 0 | Virtual circuit number. See Annex A of the 1984 ITU-T X.25 Recommendation for information on VC assignment. |
| cause 7 | Code indicating the event that triggered the packet. The cause field can only appear in entries for CLEAR REQUEST, RESET REQUEST, and RESTART packets. Possible values for the cause field can vary, depending on the type of packet. Refer to the "X.25 Cause and Diagnostic Codes" appendix for explanations of these codes. |
| diag 0 | Code providing an additional hint as to what, if anything, went wrong. The diag field can only appear in entries for CLEAR REQUEST, DIAGNOSTIC (as "error 0"), RESET REQUEST and RESTART packets. Because of the large number of possible values, they are listed in the "X.25 Cause and Diagnostic Codes" appendix. |
Table 2-98 describes the PS and PR fields that can appear in a debug x25 all display.
| Field | Description |
|---|---|
PS 0
| Packet send sequence number; used for flow control of the outgoing packet stream. Present only in DATA packets. |
PR 0
| Packet receive sequence number used for flow control of the incoming packet stream by indicating the PS value that the sender next expects to see. |
In Figure 2-154, notice also that the CALL REQUEST packet precedes three other lines of output that have a unique format.
Serial2: X25 I P1 CALL REQUEST (11) 8 lci 1024
From (2): 49 To(2): 46
  Facilities: (0)
  Call User Data (4): 0xCC 00 00 00 (ip)
Serial2: X25 O P4 CALL CONNECTED (3) 8 lci 1024
These lines indicate that the CALL REQUEST packet has a two-digit source address, 49, and a two-digit destination address, 46. These are X.121 addresses that can be from 0 to 15 digits in length. The Facilities field is (0) bytes in length, indicating that no X.25 facilities are being requested. The optional call user data field is 4 bytes in length. Any encapsulation protocol identification (PID) in the Call User Data will have the encoding values printed and identified. Multiprotocol Virtual Circuits can also have PID information in Data packets; the debug output for these packets will also describe the PID.
The two lines of output in Figure 2-154 that begin with XOT are shown below.
XOT: X25 O D1 PVC-SETUP, waiting to connect (29) <Serial2 pvc 3><Serial2 pvc 1> 2/1 128/64
XOT: X25 I D1 PVC-SETUP, connected (29) <Serial2 pvc 3><Serial2 pvc 1> 2/1 128/64
These lines of output do not describe standard X.25 packets. Instead, they describe messages that represent a tunneled PVC setup between two routers. Table 2-99 describes the fields these two lines of output.
| Field | Description |
|---|---|
| XOT | This message travels over a TCP connection. |
| X25 | This message describes an X.25 event. |
O
| Indication of whether the X.25 message was input (I) or output (O) through the connection. |
D1
| State of the permanent virtual circuit. Possible values follow.
D1--Flow control ready D2--DTE reset request D3--DCE reset indication See Annex B of the 1984 ITU-T X.25 Recommendation for more information on these states. |
| wait to connect | State of the PVC. Some of these strings only apply to PVCs that are remotely tunneled over a TCP connection. The %X25-3-PVCBAD system error message (as documented in the System Error Messages publication), and the show x25 vc command (as documented in the Router Products Command Reference publication) also use these PVC state strings. Possible values follow:
awaiting PVC-SETUP reply can't support flow control values connected dest. disconnected dest. interface is not up dest. PVC configuration mismatch mismatched flow control values no such dest. interface no such dest. PVC non-X.25 dest. interface PVC setup protocol error PVC/TCP connect timed out PVC/TCP connection refused PVC/TCP routing error trying to connect via TCP waiting to connect |
| (29) | Incoming/outgoing message size (in bytes). |
| <Serial2 pvc 3> | Interface and PVC number that originated the message (originator). |
| <Serial2 pvc 1> | Interface and PVC number that responded to that message (responder). |
| 2/1 | Window sizes (in packets). |
| 128/64 | Maximum packet sizes (in bytes). |
Use the debug x25 events EXEC command to display information on all X.25 traffic except X.25 data or acknowledgment packets. The no form of this command disables debugging output.
debug x25 eventsThis command has no arguments or keywords.
EXEC
The debug x25 events command is useful for debugging X.25 problems, because it shows changes that occur in the virtual circuits handled by the router. Because most X.25 connectivity problems stem from errors that CLEAR or RESET virtual circuits, you can use debug x25 events to identify these errors.
While debug x25 all output includes both data and control messages for all of the router's virtual circuits, debug x25 events output includes only control messages for all of the router's VCs. In contrast, debug x25 vc output filters the output for a single VC number. Thus, debug x25 events output is a subset of debug x25 all output, and debug x25 vc output modifies either of them to further limit the output.
Figure 2-155 shows sample debug x25 events output.
router# debug x25 events
Serial2: X25 I R3 RESTART (5) 8 lci 0 cause 0 diag 0
Serial2: X25 I P1 CALL REQUEST (11) 8 lci 1024
From (2): 49 To(2): 46
  Facilities: (0)
  Call User Data (4): 0xCC 00 00 00 (ip)
Serial2: X25 O P4 CALL CONNECTED (3) 8 lci 1024
Serial2: X25 I D1 CLEAR REQUEST (5) 8 lci 1024 cause 0 diag 122
Serial2: X25 O D1 CLEAR CONFIRMATION (3) 8 lci 1024
Serial2: X25 O D1 RESET REQUEST (5) 8 lci 1 cause 0 diag 122
Serial2: X25 I D1 RESET CONFIRMATION (3) 8 lci 1
See the debug x25 all command description for information on the fields in debug x25 events output.
Use the debug x25 vc EXEC command to display information on traffic for a particular virtual circuit in order to solve any connectivity or performance problems it is exhibiting. The no form of this command removes the filter for a particular virtual circuit from the debug x25 all or debug x25 events output.
debug x25 vc number| number | VC number associated with the virtual circuit(s) you want to monitor. |
EXEC
Because no interface is specified, traffic on any VC that has the specified number is reported.
The debug x25 vc command limits the output of debug x25 all or debug x25 events output to the packets occurring on a particular VC number. This command modifies the operation of the debug x25 all or debug x25 events commands, so one of those commands must be used with debug x25 vc to produce output.
VC 0 cannot be specified. It is used for X.25 service messages, such as RESTART packets, not VC traffic. VC0 can be monitored only when no VC filter is used.
Figure 2-156 shows sample debug x25 vc output.
router#debug x25 vc 1X25 debugging output restricted to VC1 router#debug x25 eventsX25 special event debugging is on router#show debugX.25 (debugging restricted to VC number 1): X25 special event debugging is on Serial0: X25 0 P2 CALL REQUEST (19) 8 lci 1 From(14): 31250000000101 To(14): 31109090096101 Facilities (0) Serial0: X25 I P2 CLEAR REQUEST (5) 8 lci 1 cause diag 122
See the debug x25 all command description for information on the fields in debug x25 vc output.
Use the debug xns packet EXEC command to display information on XNS packet traffic, including the addresses for source, destination, and next hop router of each packet. The no form of this command disables debugging output.
debug xns packetThis command has no arguments or keywords.
EXEC
To gain the fullest understanding of XNS routing activity, you should enable debug xns routing and debug xns packet together.
Figure 2-157 shows sample debug xns packet output.
router# debug xns packet
XNS: src=5.0000.0c02.6d04, dst=5.ffff.ffff.ffff, packet sent
XNS: src=1.0000.0c00.440f, dst=1.ffff.ffff.ffff, rcvd. on Ethernet0
XNS: src=1.0000.0c00.440f, dst=1.ffff.ffff.ffff, local processing
Table 2-100 describes significant fields shown in Figure 2-157.
| Field | Description |
|---|---|
XNS:
| Indicates that this is an XNS packet. |
| src = 5.0000.0c02.6d04 | Indicates that the source address for this message is 0000.0c02.6d04 on network 5. |
| dst = 5.ffff.ffff.ffff | Indicates that the destination address for this message is the broadcast address ffff.ffff.ffff on network 5. |
| packet sent | Indicates that the packet to destination address 5.ffff.ffff.ffff in Figure 2-157, as displayed using the debug xns packet command, was queued on the output interface. |
| rcvd. on Ethernet0 | Indicates that the router just received this packet through the Ethernet0 interface. |
local processing
| Indicates that the router has examined the packet and determined that it must process it, rather than forwarding it. |
Use the debug xns routing EXEC command to display information on XNS routing transactions. The no form of this command disables debugging output.
debug xns routingThis command has no arguments or keywords.
EXEC
To gain the fullest understanding of XNS routing activity, enable debug xns routing and debug xns packet together.
Figure 2-158 shows sample debug xns routing output.
router# debug xns routing
XNSRIP: sending standard periodic update to 5.ffff.ffff.ffff via Ethernet2
  network 1, hop count 1
  network 2, hop count 2
XNSRIP: got standard update from 1.0000.0c00.440f socket 1 via Ethernet0
  net 2: 1 hops
Table 2-101 describes significant fields shown in Figure 2-158.
| Field | Description |
|---|---|
XNSRIP:
| This is an XNS routing packet. |
| sending standard periodic update | Router indicates that this is a periodic XNS routing information update. |
| to 5.ffff.ffff.ffff | Destination address is ffff.ffff.ffff on network 5. |
| via Ethernet2 | Name of the output interface. |
| network 1, hop count 1 | Network 1 is one hop away from this router. |
| got standard update from 1.0000.0c00.440f | Router indicates that it has received an XNS routing information update from address 0000.0c00.440f on network 1. |
| socket 1 | The socket number is a well-known port for XNS. Possible values include
1--routing information 2--echo 3--router error |
|
|