Tensor_Vis program description.
The Tensor_Vis program is intended for visualisation of tensors, in particular the moment of inertia and quadrupolar moment. In numerous papers published in respected scientific journals there are erroneous graphic presentations of local quadrupolar moments. The pictures contain simple cigar-shaped objects of various orientations, while, as it is shown below, the proper presentation requires in fact more complex geometrical objects.
User manual.
Program requires the presence of MS Windows 98/Me/2000/XP. There is also a possibility to use the program under Window 95 operating system after installing the OpenGL graphic libraries required by the program. The minimum requirements concerning the processor and RAM coincide the requirements of the operating system itself. Because the program operation strongly depends on the 3D graphic capabilities of the system the presence of a 3D graphic accelerator (Riva TNT class or better) is recommended. However there is a fair possibility that the program operation in a system without accelerator will be also tolerable.
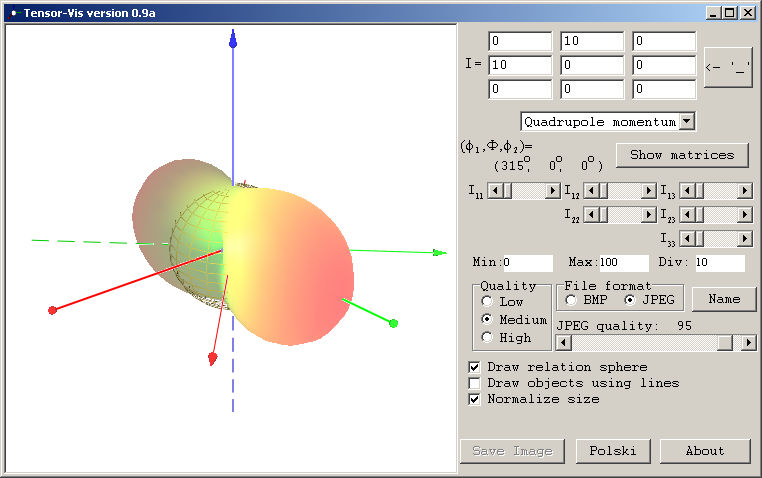
After starting the program the main window appears, with two areas clearly distingushed: the area in which the tensor visualisation takes place and the area containing the standard Windows control elements, used for configuration and operation of the program.
The picture contains two coordinate systems
The axis lines ended with arrow-heads: the reference coordinate system, OX axis red, OY axis green, OZ axis blue.
The axis lines ended with spheres: the main (principal) axes coordinate system. The color labeling of individual axis the same as above.
The right-hand side of the application window contains the following elements:
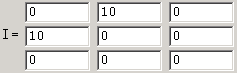
9 fields used for typing in the values of the inertia or quadrupolar tensor components.
![]()
Button used for clearing the values of tensor components.
![]()
The list used for selection of the visualised object type: moment of inertia or quadrupolar tensor.
Information concerning the orientation of the main axis coordinate system with respect to the reference coordinate system, namely the Euler angles.
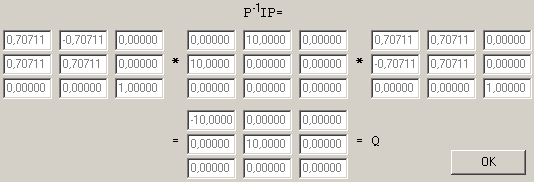
The "Show matrices" button, used for presentation of the operation (matrix), which transforms the tensor to the main axes reference system. The respective window looks as follows:
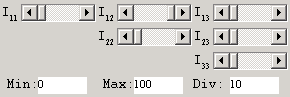
Sliders and number fields used for fast setting of the tensor values. Because both the inertia and quadrupolar tensors are symmetric six sliders are enough. The left-most slider position sets the respective component value to Min/Div (in the present case 0.0), and the right-most position to Max/Div (in the present case 10.0)
The "quality" field allows the specification of the level of details (complexity) in the visualised scene. If the computer is fast enough the "High" option may be chosen and then the scene will include many details and therefore many triangles, which form the graphic presentation. On the other hand if the computer is not very effecient the "Low" option should be chosen. The scene contains smaller number of triangles, thus compromising the picture quality (the picture is not so smooth, the shapes contain visible "edges").
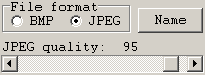
In that area the details of the output image file are specified: the required graphic format, its filename and the quality setting for the JPEG format. After selection of the filename the "Write Image" button becomes accesible, and its activation results in writing the file to disk.
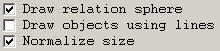
If the "Draw the reference sphere" field is marked then a unit radius sphere is also drawn. It is important, because when the "Normalise the size" option is selected, the whole picture is scaled respectively, to fit the image into program window.
If the "Draw the objects as lines" field is marked for all the objects only the lines will be drawn, what makes the objects completely transparent.